
How Many Yusho Will Onosato Win? Let's Guess and Advanced Model! Code Included
Part 2

Last week we tried to come up with various models to at least get started on accurately guessing new Yokozuna Onosato’s career Yusho total. We began with using simple intuitive models and even some basic data, but ultimately they were rather rigid.
Onosato has been a healthy wrestler thus far, and I see no reason for that to stop anytime soon, but we all know that sumo is a contact intensive sport and like any athletic competition, injury is an unfortunate ever present possibility. Luckily it’s a small probability but our previous models feel lacking for not at least including that in a more explicit way. In fact, ideally we would lay out the various probabilities such as how long he wrestles for, how likely he is to win any given tournament within that timespan, and how (hopefully) unlikely he is to suffer an injury. Then we could run that model 100’s or even 1000’s of times and get a look at the various ways his career could play out. Even better would be if this model were flexible to allow us to tweak those various probabilities, so if you think my projections were overly optimistic (or pessimistic) you could run it with your numbers and get results.
The good news is that’s exactly what we’re doing today with a Monte Carlo model! I will include the python code at the bottom so that you can run it yourself too. I’ll walk through the various inputs we want, justify the initial assumptions we use, and then we can actually do the Monte Carlo part which consists of using those assumptions and running the model many times to show us what Onosato’s career Yusho total might look like.
Feel free to skip to the end if you only want to see the results and get the code to run it yourself. Otherwise I’ll walk through how we built up to those results.
Career Longevity
Last week we found that Yokozuna with 10+ Yusho retired on average at 32 almost 33 years old. The standard deviation is a little over 2 years. Don’t worry too much about standard deviation - it’s essentially “add or subtract this to the average and it should cover most cases” - not a perfect definition but good for a layperson’s understanding.

So we’ll use 33 as the “average” retirement assumption for Onosato and have a standard deviation of 2. That means that in our model on average he will compete till he’s 33 and careers where he ended up retiring somewhere between 31 (33-2) and 35 (33+2) should cover the majority of cases - about 2/3 in fact.
Tournaments Won
In large part a good model is based on the following: is the structure of the model good, and are the assumptions good?
Starting with the structure, I don’t think our previous version where we simply chose “how many tournaments will Onosato win in his age 25 year” and so on was bad. But I also think we can improve. So for this model, what we’ll do is have individual tournaments as our unit of prediction; i.e. the next tournament, Onosato has a 50% chance of winning. That introduces more chance into it, which is how reality tends to work, and also let’s us get more granular in terms of our predictions.
Injury Probabilities
Like I said before, this unfortunate chance does exist. If we could donate our health to our favorite wrestlers then Terunofuji’s knees would be a lot better, and we wouldn’t have to entertain this thought, but alas we do. So for injury probabilities I think we should actually have 2 separate figures used. One probability is just the probability in any given tournament Onosato picks up a minor knack. He will be able to continue fine in the next tournament, but he’ll be out of the Yusho race for the current one. The other one is catastrophic injury which results in the end of his career. It hurt typing that out but again, we want to have a good model and we do have to consider such things.
Putting It All Together
Let’s just get our general process out there.
First, we’ll estimate at which age Onosato will retire - likely between ~31-~35. That will give us a number of tournaments or Yusho opportunities.
Next, we will go through all those tournaments, however many there are, and use the probability he wins that tournament subtracting out the minor injury probability.
Finally, we’ll apply the catastrophic injury probability and if he’s fine (he will be!) then we continue to the next tournament.
I’ll talk about the implementation and the odds I used for the tournament wins in the next section, but real quickly, I put this in a mathematical equation.
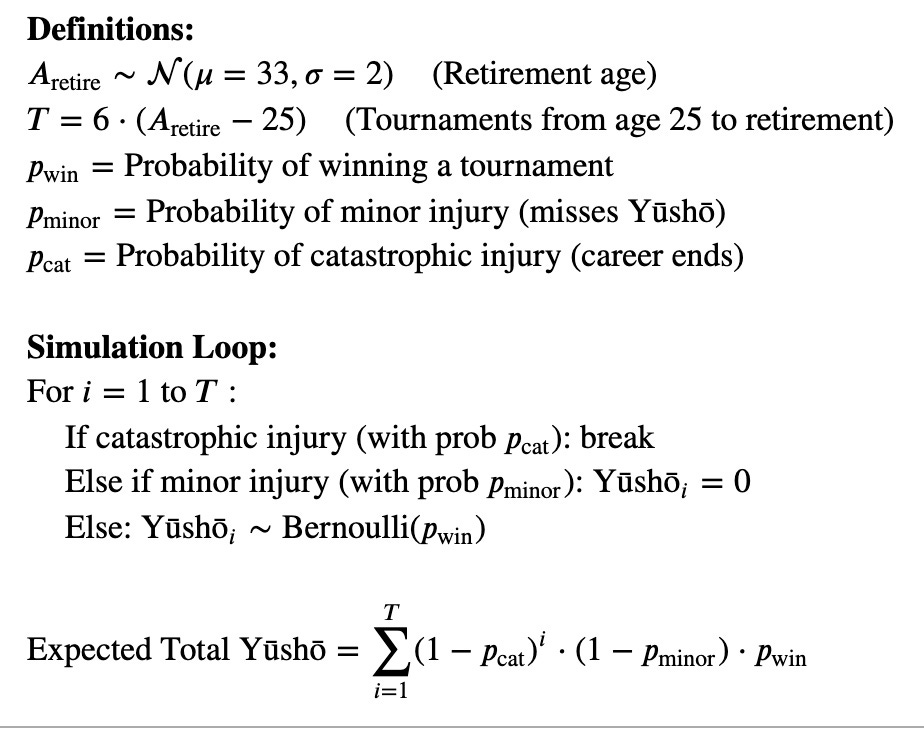
Don’t worry - this looks intimidating to me too, but it’s nothing new here. First we begin with his retirement age, simple enough. Then the T is just figuring out how many tournaments he’ll participate in which is his retirement age, minus 25 (his age as of next tournament) multiplied by 6 to account for 6 tournaments a year.
We still haven’t proposed the probabilities to use yet- that’s in the next step - but we do know that we’ll need them and so can define them. Then we end up with a loop where we go through each tournament, check for the injury probabilities and see if he won.
That leaves us with the Bernoulli, which I think Wikipedia does a solid job summing up: “In probability theory and statistics, the Bernoulli distribution, named after Swiss mathematician Jacob Bernoulli, is the discrete probability distribution of a random variable which takes the value 1 with probability p and the value 0 with probability q=1−p”
In English we use a Bernoulli distribution when we’re modeling something which can be only one of two values. Well in this case we’re modeling if Onosato will win or lose a tournament, so we use the Bernoulli.
The Expected Total Yusho equation at the bottom is just putting it all together. It looks a bit confusing, but we hopefully all can understand the general process. As someone who has struggled through many a statistics textbook, I wish they built up to those abstract equations via examples like this, so hopefully I’m being the change I want to see in this world and you can follow.
Filling In the Blanks - How to Handle Tournament Win Probabilities
For simplicities sake, I’ll just have the injury probabilities flat over time. Obviously it would be better to have them start relatively low as he’s young now and get higher over time, but no need to make this too complex. There can also be virtue in keeping your models simple not only to reduce the number of chances to make a mistake implementing the model, but also in terms of understanding the model itself.
So I’ll use 7% for the minor injury probability and then .5% for catastrophic injury probability.
That leaves us only the probability that he wins any given tournament. Here I will actually do a more complicated implementation instead of one flat percentage for his entire career.
In this case I’ll use 4 different numbers consisting of:
Yokozuna Peak/Current: 60%
Yokozuna - Rivals Emerge: 50%
Yokozuna - Decline Phase: 30%
Yokozuna - Final Hurrahs: 15%
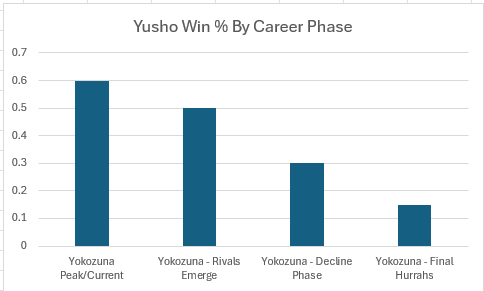
I’ll structure the model so that each of these phases is given equal length. In this case that means for 25% of his remaining tournaments he’ll have a 60% chance to win the Yusho, followed by 50% and so on. That said, I will provide the code so if you think there should be 2 phases, or 10 phases or even one for each individual tournament, you’re free to mess around with those inputs.
Results!
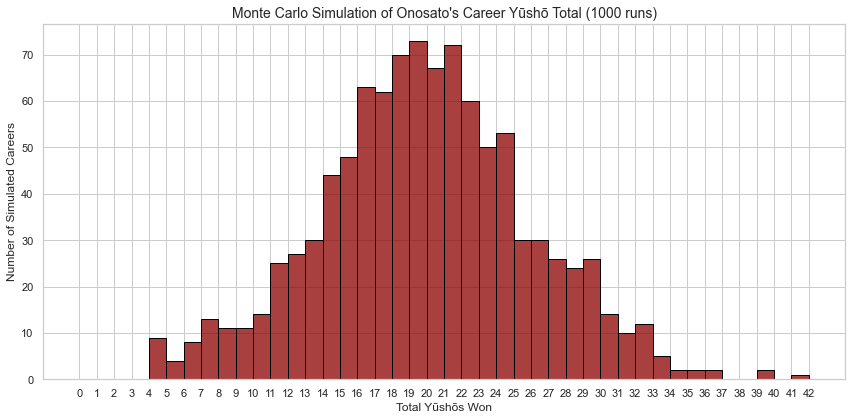
Mean Yūshō: 19.42
Median Yūshō: 19.0
Chance of 10+ Yūshō: 94.4%
Just as a note - this is not numerically stable. That is to say, if you run everything with the exact same variables you will get a different result. Still, it shouldn’t be hugely different.
Conclusions
A model is only as good as its assumptions. Looking at my assumptions they seem reasonable but then again I wrote them so of course I’d say that. Still, assumptions aside I think that we put together a compelling structure that allows for quickly testing how many Yusho Onosato will when with a variety of different inputs. Even if you aren’t a programmer, I would encourage you to give this a shot if you think different numbers should be used. The inputs are all up top before the “Simulation Function” bit. If you want to change the number of career phases then you can simply add or reduce the size of the list so [.50, .20] or [0.60, 0.50, 0.30, 0.15, .05] and note that they are percentage form so if you do 50 instead of .5 that’ll cause issues. Replit can be signed up for and should be able to run this code for free.
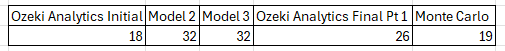
Here’s the final table comparing the various numbers I arrived at with varying methods; funny that I started with 18 Yusho as my guess and ended up with my most in-depth model yielding a single more Yusho than my shot in the dark. Cheers!
Extra Credit: as usual I try to balance between readability and simplicity vs accuracy. In this case, I would like to note that a lot of the assumptions here are based on the idea that these outcomes are normally distributed.
Code:
import numpy as np
import matplotlib.pyplot as plt
import seaborn as sns
# --- Model Parameters ---
# Career assumptions
mean_retire_age = 33
std_retire_age = 2
start_age = 25
tournaments_per_year = 6
# Injury probabilities
p_minor_injury = 0.07
p_catastrophic_injury = 0.005
# Career phases and win probabilities
win_probs = [0.60, 0.50, 0.30, 0.15]
# Peak, Rivals, Decline, Final
phases = 4
# Number of phases to divide career into
# Simulations
n_simulations = 1000
# --- Simulation Function ---
def simulate_yusho_total():
# Sample retirement age (cap to stay in a reasonable range)
retire_age = np.clip(np.random.normal(mean_retire_age, std_retire_age), 28, 40)
total_tournaments = int((retire_age - start_age) * tournaments_per_year)
# Handle edge case
if total_tournaments <= 0:
return 0
# Phase lengths (evenly split)
phase_len = total_tournaments // phases
win_schedule = []
for i in range(phases):
win_schedule += [win_probs[i]] * phase_len
# Fill remainder with last phase probability
win_schedule += [win_probs[-1]] * (total_tournaments - len(win_schedule))
yusho_count = 0
for prob in win_schedule:
if np.random.rand() < p_catastrophic_injury:
break # Career-ending injury
if np.random.rand() < p_minor_injury:
continue # No chance to win this basho
if np.random.rand() < prob:
yusho_count += 1 # Wins Yusho
return yusho_count
# --- Run Simulations ---
yusho_results = [simulate_yusho_total() + 4 for _ in range(n_simulations)]
# --- Plot Results ---
sns.set(style="whitegrid")
plt.figure(figsize=(12, 6))
sns.histplot(yusho_results, bins=range(0, max(yusho_results) + 2), kde=False, color="darkred", edgecolor="black")
plt.title("Monte Carlo Simulation of Onosato's Career Yūshō Total (1000 runs)", fontsize=14)
plt.xlabel("Total Yūshōs Won")
plt.ylabel("Number of Simulated Careers")
plt.xticks(range(0, max(yusho_results) + 2))
plt.tight_layout()
plt.show()
# --- Summary Stats ---
mean_yusho = np.mean(yusho_results)
median_yusho = np.median(yusho_results)
percent_10plus = np.mean(np.array(yusho_results) >= 10) * 100
print(f"Mean Yūshō: {mean_yusho:.2f}")
print(f"Median Yūshō: {median_yusho}")
print(f"Chance of 10+ Yūshō: {percent_10plus:.1f}%")